How We Made our Rich Text Editor Load Faster - Part 1

When we try to open huge documents in the editor, it takes several seconds before it loads. What can we do to optimize loading speed?CKEditor Customer
CKEditor is an innovative and highly customizable rich text editor. Unfortunately, its powerful and extensible architecture comes at a cost - specifically, a performance cost. CKEditor 5 is slower than its predecessor when loading huge or unusually structured documents.
Over the years, we have shipped several performance improvements. At some point, though, we have run out of the obvious, “low-hanging fruit” solutions. Still, the editor’s performance was not as good as we would like to see it. We had ideas that should lead to drastic performance improvements. But they would be fundamental architectural changes, meaning risky, possibly a year-long project that could result in breaking changes for many applications.
These are all valid ideas, but we needed a solution faster. So, we decided to launch a performance improvement project with a shorter, a few-month time horizon, focusing on deep changes but within the existing architecture. Our goal was to ease some of the pain instantly while gaining more time for the big project. We hoped to reduce the loading time by 30%, maybe 40%.
The results exceeded our expectations. It wasn’t 40% or even 50% but… 500% to 2000%, depending on the size of the document. This blew us away. Today we would like to share the story behind this project and how we achieved these results.
But What is a Huge Document?
Before going further, we need to explain what, precisely, we had a problem with. The answer might be counter-intuitive, especially for non-technical readers. We noted, that the issue was with huge documents.
So, what is a huge document?
Naturally, we first think about volume, that is, how many pages the document has. Or maybe how many words the document includes, as page count is often affected by formatting factors, like font size.
In reality, the problem lies elsewhere. What really matters from the perspective of the editor architecture is the number of HTML tags and attributes included in the document. A hundred-page-long book may load in the same amount of time as a several-page-long article full of links, some tables, and a lot of text formatting.
The biggest challenge, though, are these two use cases:
- Legacy HTML documents – often created in other software, with messy non-semantic HTML, and a lot of HTML tags and attributes that usually don’t even affect what the document looks like.
- Specific cases where a lot of HTML tags are used – for example, applications that require assigning tags to specific (or all!) of the words in the document.
Oftentimes, we are asked “what length of documents” can the editor support (while offering a smooth user experience). It is not possible to answer this question in a straightforward way.
“HTML tags”, although being more precise, is not a perfect metric, since how exactly the document is structured also matters, as does which features of the editor are most commonly used. Not to mention outside factors like other libraries used by the integrated application – that was not our concern for this project, though.
Of course, the sheer amount of text in the document does matter - for example, it affects the browser’s rendering time. But the performance problems reported to us were never just about “200 pages of plain text”. It was always something more complex.
This is why we needed to do our research using various document samples. Some of the samples were taken directly from CKEditor users.
“Huge document” is a relative term and it does not define the scale. You can always try to load a larger document. When “200 pages” loads fast, there’s a need for “500 pages”. When that works well, the next user will want to load a 1000, 2000, or 3000 pages-long document. At some point, the browser itself has a problem rendering such a big DOM. We are aware of mechanisms like content streaming, but early on, we made a decision not to design the editor’s engine around it, as it would add another layer of complexity to an already complicated system.
The Testing Methodology and the Results
Before we dive into the full story and technical details, let’s talk about the results we achieved. Everyone loves numbers, right?
First, we generated several documents, each focused on a specific use case. If interested, you can check the content of these documents in the CKEditor 5 Github repository.
These documents contain:
- 5000 paragraphs with no formatting (~400 A4 pages),
- 3000 list items, making a nested structure with no formatting (~100 A4 pages),
- A table with 2000 rows and 10 columns (20000 cells total),
- 40 huge paragraphs with excessive formatting (~100 A4 pages),
- 30 huge paragraphs with excessive formatting provided as inline styles (~100 A4 pages),
- Wikipedia main page source, copied four times, to test unsupported HTML.
These are the results that we recorded before starting the project:
| Test case | Load time (ms) |
| Paragraphs | 2998 |
| Lists | 5899 |
| Huge table | 12955 |
| Huge formatting | 8991 |
| Huge inline styles | 16383 |
| Wikipedia | 10409 |
It is important to have a good, stable testing methodology.
We tested a full CKEditor setup (excluding collaboration features). The editor was placed on a blank page with no other markup or scripts. We measured the time using the incognito tab, with the browser console closed, to limit outside factors impacting the results.
We recorded the time that passed from the first line of the editor initialization to the full editor initialization (the initialization promise resolved).
For each test, the editor was initialized ten times, each time after a full page refresh. We discarded the two outlying results. There are fluctuations in browser behavior that are outside of our control, and we have seen that one out of ten tries take significantly more time. The average of the eight outstanding results was taken as the final result.
So what were the final results?
| Test case | Before (ms) | After (ms) | Difference |
| Paragraphs | 2998 | 493 | -83.56% |
| Lists | 5899 | 916 | -84.47% |
| Huge table | 12955 | 2168 | -83.27% |
| Huge formatting | 8991 | 1604 | -82.16% |
| Huge inline styles | 16383 | 2476 | -84.89% |
| Wiki | 10409 | 1848 | -82.25% |
In short: CKEditor, on average, loads 6-7 times faster than before the updates!
What’s more, the bigger the document, the bigger the gain. For some of the documents that we had received from our customers, we have seen as much as -95% difference, which translates to load speeds that are 20 times faster!
Similar results should also be experienced when pasting content into the editor.
The mechanisms that we improved when working on the loading speed are also used when the editor saves the data. As a result, coincidentally, we improved saving speed by a similar factor.
Editor Architecture (and Why it Matters)
Let’s start with a bit of a historical insight. In 2015, we started a full rewrite of CKEditor. Then-current CKEditor 4 was using the old architecture, based on DOM and heavily dependent on browser behavior. This was not sufficient for demanding use cases such as real-time collaboration.
We decided to design the new editor architecture from scratch. It was a success, and the new engine enabled many wonderful features. It is more flexible, and more stable than CKEditor 4. However it came with the price of internal complexity, and as a consequence, lower performance.
So, how does CKEditor 5 work and why is it slower than its older brother?
CKEditor 4’s architecture mostly operates on DOM structure, which is generated and maintained by the browser. It does not maintain its own state apart from the DOM structure rendered in the editable area. It is faster, because nearly all the work is done in just one layer (the actual view the user sees).
On the other hand, CKEditor 5 implements three layers:
- An abstract tree-structured data model.
- A virtual-DOM-like structure (called view).
- And finally, the real DOM.
When the editor loads the HTML document, it generates the DOM, then the view, and then the editor features digest each element in the view to generate the model. To display the document in the browser, we again take the model, convert it to the view, and then to DOM, which is put inside the editable element.
Compared to CKEditor 4, we no longer operate directly on the DOM. Instead, changes happen on the model layer and are propagated down to the DOM. This architecture enables the implementation of really demanding features and provides a way more predictable environment for feature developers.
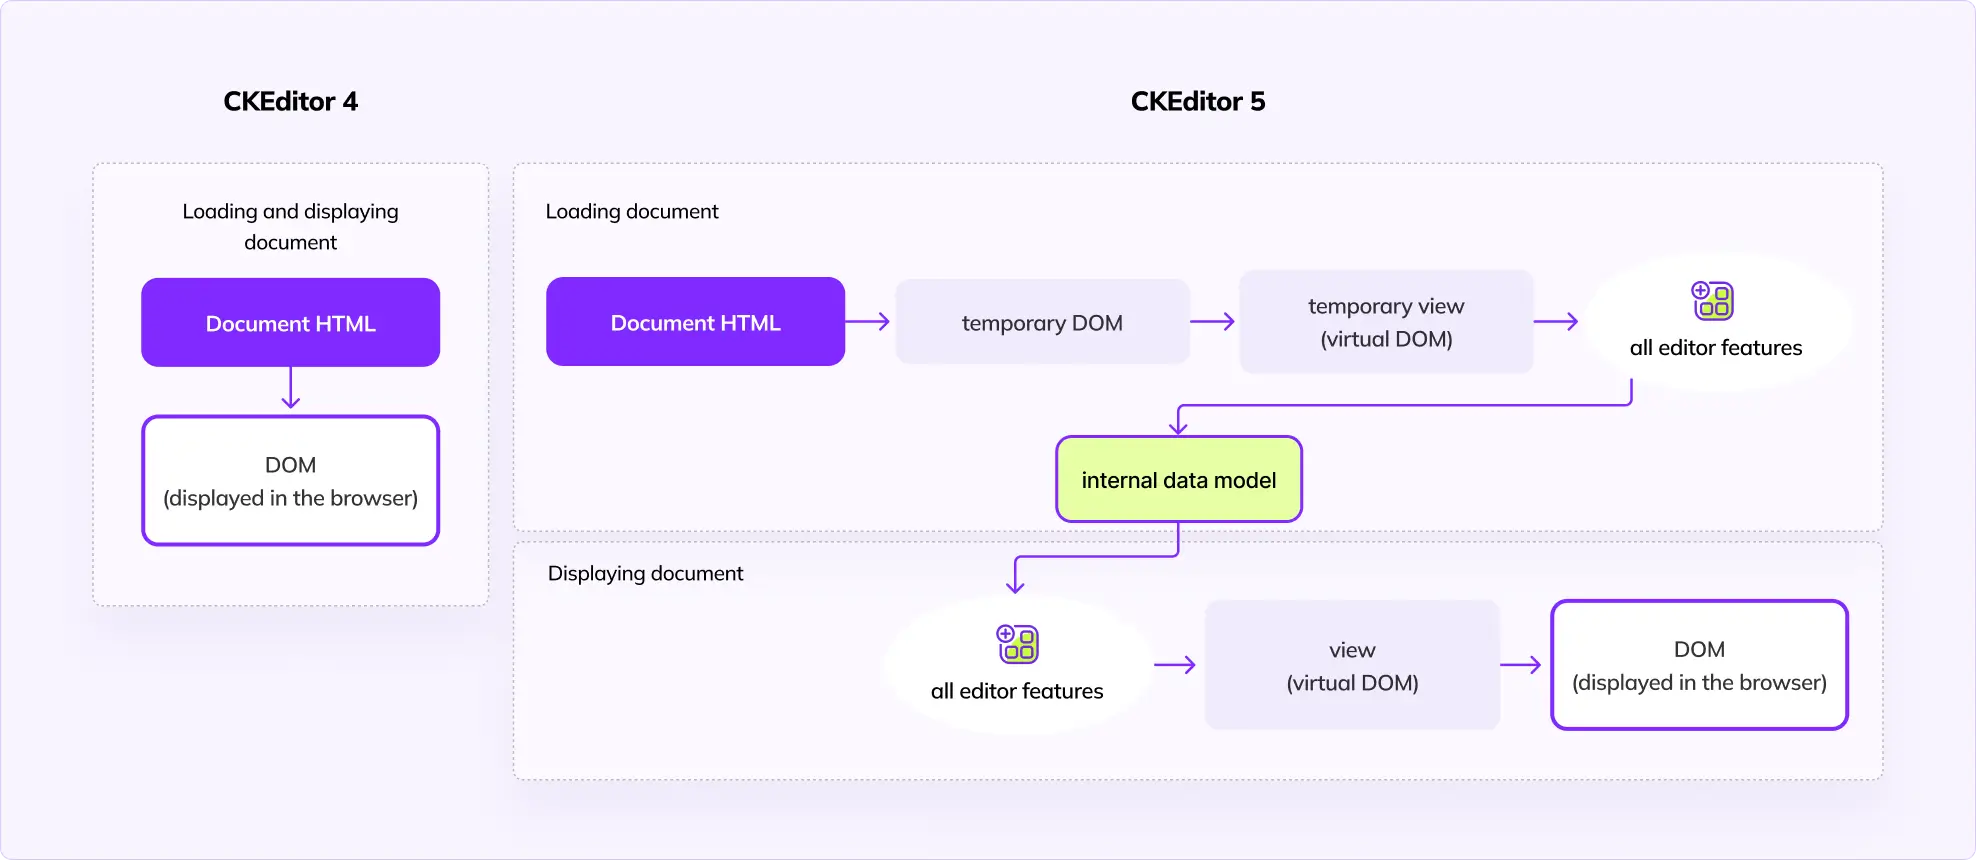
As a result, CKEditor 5 needs a few more extra steps to load the document. The view ↔ model conversion is especially time-consuming, as every DOM node/model element must be processed by multiple features.
Approaching Performance Problems
Premature optimization is the root of all evil.Donald Knuth
Personally, I believe that it is this quote, that is the root of all evil, and I consider it harmful. It is not Knuth’s fault, though. The quote is simply poorly interpreted.
It is not about disregarding performance until the actual problems are reported. Rather, it is about correctly assessing what may become a problem, testing against it, and fixing it. If you wait until the problem is actually reported, your system may become large and interconnected in the meantime, making your job orders of magnitude more difficult.
The first tool we turned to is the browser’s performance profiler. The profiler chart was absolutely scary at first glance. The system is complex and most of the time is spent inside dozens of small functions or short loops. There’s no chunky function at the bottom of the call tree, pointing to a clear bottleneck. Instead, it feels like you are dying from a thousand cuts. There are no low-hanging fruits, no obvious places to start, and it leaves you with just one conclusion: it has to be that way, there’s just a lot of data to process.
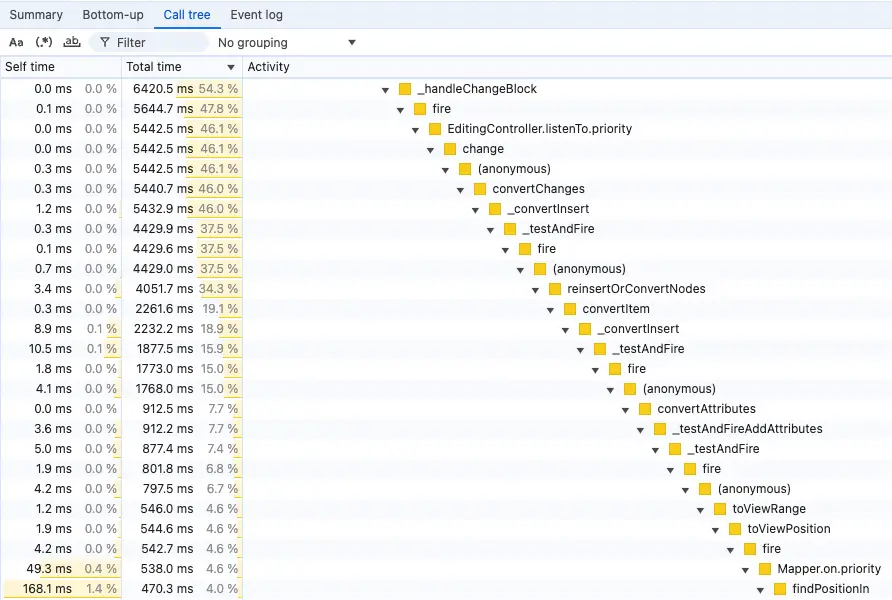
Presented above is the “Call tree” view, which shows how the functions are nested in each other, and how much time every sub-called function contributed to the time of the parent function. In a large system, it may be difficult to make much use of this, if there’s no glaring bottleneck. In the picture, you can see that the total time taken washes away with every nested sub-call, and there is not a single function call where the editor was stuck for a longer period of time.
Sometimes, a function is used many times, in many call paths. It may take a lot of time in total, but that is hard to identify from the “Call tree” view.
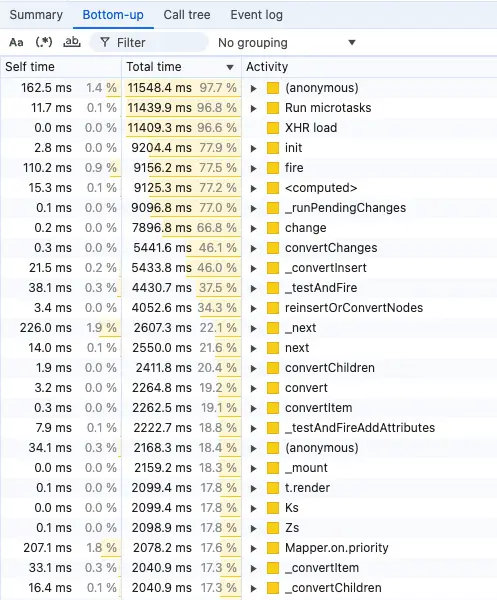
For this, we use the “Bottom-up” view, presented below. This view “sums up” all the calls for a given function. Here, you can learn which function took a bigger piece of the total initialization time.
But you still have to assess whether it makes sense or not – that’s the hard part. You might notice a short function that is called millions of times, but it may be hard to judge whether you should further optimize the function, or the algorithms that use the function (so it is called less often), or maybe the whole process should get redesigned. Or maybe it has to be this way, there’s just a lot of data to process.
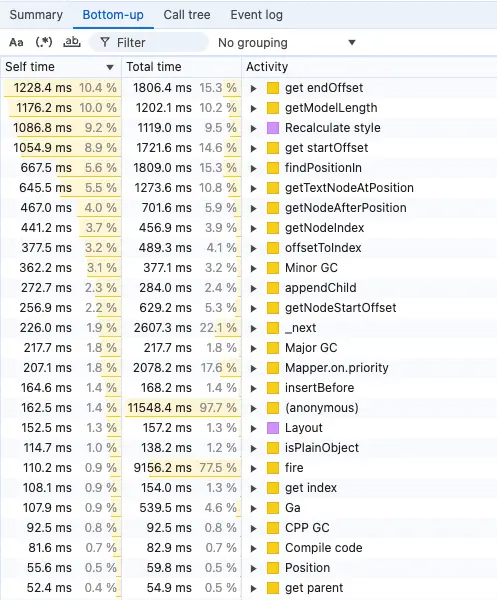
The bottom-up view will tell you which functions are “hot”.
Sometimes it is inevitable that they take so much time, other times you need to fix it.
We first look at the “Self time” column, to see if there are functions that take a lot of total time (>5%), and we know they are not called that often. These are low-hanging fruit, where we pinpoint that a given function should be optimized. Unfortunately, there were very few cases like this, as we had solved most issues of this kind in the past.
Then, we look at “Total time”. Ignore the top few results, they are top-level functions that are expected to take a lot of time. Instead, we try to spot low-level functions that are relatively high on this list. This way, we locate potential problematic functions which are called many times, in multiple different execution paths. One call may take a small amount of time, but summed up it becomes a problem.
The whole process requires a mix of intuition and a solid understanding of the editor engine. Thankfully, a lot of the original CKEditor 5 team is still working on the project. This gave us a big advantage of remembering where we initially neglected performance problems in the past.
We had some ideas about where problems may lie, and the profiling confirmed them. These were jackpots and contributed to most of the results. Then, we managed to find some more issues, using the described approach, and carefully assessing each suspicious function.
On the other hand, we knew about some parts of the code that we were sure would lead to performance problems, but we haven’t seen it in the performance profile. For example, we knew that the TreeWalker class is overused and creates a lot of Position instances as the data is initialized.
Indeed, in the “huge table” sample, we logged that it created a few million instances of the Position class. We expected this to take a lot of time. The profiler didn’t show it, but we thought that it may have been “hidden” in other functions’ execution time.
So, we managed to cut this massive number of positions in half. But, to our surprise, it led to almost no change in the editor’s performance.
In another case, we found a suspicious function, also related to TreeWalker usage. We optimized it, and the profiler showed that, indeed, the function takes ~500ms less. But the total time did not change. For some reason, other functions in this execution path started to take more time.
We tried various different approaches regarding code organization, thinking that maybe we messed up some JavaScript engine micro-optimizations, as nothing else made sense. To this day, we are clueless as to what happened here. This story shows that sometimes you simply run into traps. Even though we made perfectly logical changes, and measured their positive results, it didn’t change the outcome for reasons unknown.
From the very beginning, we agreed to entirely skip the subject of JavaScript engine micro-optimizations. For those who are not familiar with this topic: if you know how the JavaScript engine is written internally, you can leverage this to write and structure your code in a way that makes it run faster, without changing code logic. As long as you have algorithmic-level problems in your code, where you can lower the computational complexity, it is far more beneficial to solve these algorithmic problems instead.
Looking for possible JavaScript engine micro-optimizations is an incredibly daunting task, especially in such an extensive code base as CKEditor’s. And it is like playing with a black box. Or multiple black boxes, as there are a few JavaScript engines used by various browsers.
At the same time, the results tend to be not nearly as impressive as, e.g., lowering complexity from quadratic to linear. I would not recommend focusing on these micro-optimizations, unless you have a simple application or a service, and there’s no other room for improvement.
Before diving even deeper to particular problems we solved, two subjects are worth mentioning. We have paid a lot of attention to them, starting from the very beginning of this almost decade-long journey.
First, we always put a lot of effort into maintaining a logical, well-structured code architecture where concerns and responsibilities are clearly separated and where the code is reasonably split on public and private APIs. It is a tough task, and we often have lengthy discussions on these matters.
But this effort pays off during projects like this one. It gives us more confidence when we change the core of the editor. During this project, we introduced two non-trivial conceptual changes in the heart of the editor engine. Yet, we were able to keep these changes in a very tight scope of a few classes, in their private space.
Another huge help comes from maintaining a solid base of automated tests. We keep 100% code coverage for the project. It does not guarantee that nothing ever breaks – even with 100% code coverage you can still miss some of the edge cases. But it is another enormous confidence booster when all the old tests pass after you introduce a substantial change in the low-level engine mechanism.
This is how we approached the performance challenges we had, so let’s conclude here and close the first part of this article.
In part two of this piece, we’ll take a deeper dive into what we did to fix those issues, and the results that we saw from our approach.
We encourage everyone to update to the newest CKEditor 5 version to benefit from the improved editor loading performance. If you still experience performance problems, please contact us through technical support. Learning about specific use cases gives us invaluable insight when we approach such complex problems as the editor’s performance.